The premium article will be available in00:00:00
11.08.2025 10:02 AM
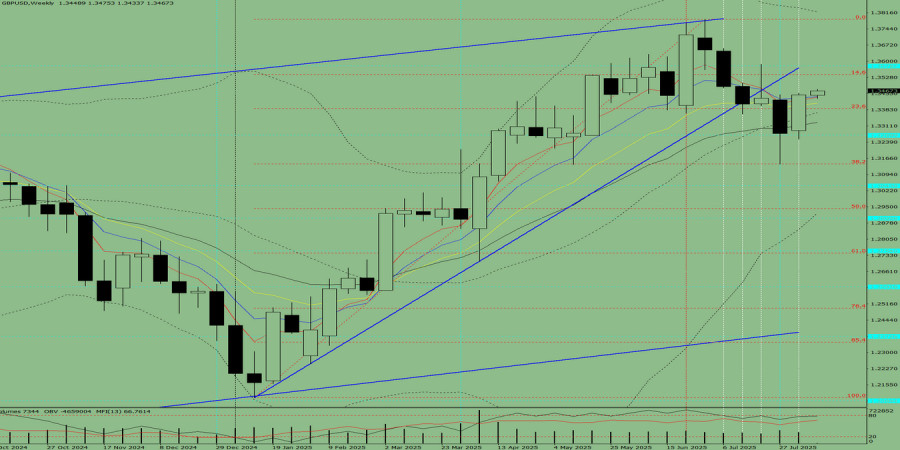
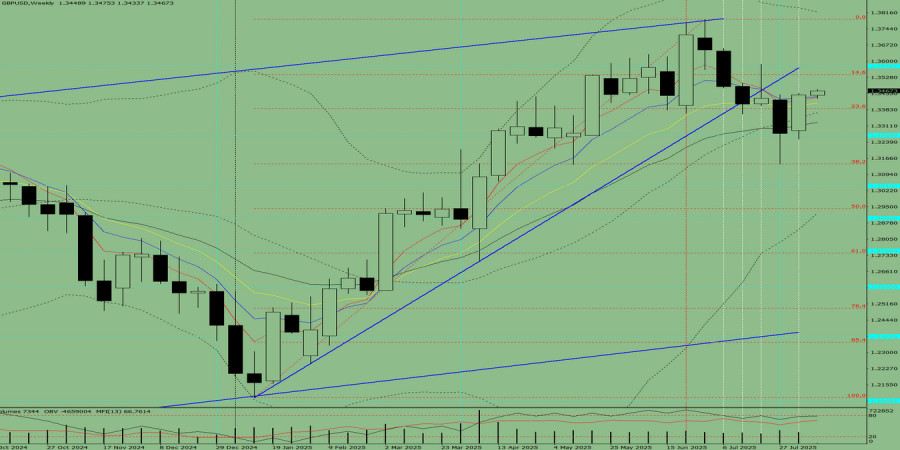
Trend AnalysisThis week, from the 1.3450 level (close to the last weekly candle), the price may start moving downward toward 1.3270 – a historical support level (blue dotted line). Upon testing this level, the price may continue moving downward toward 1.3141 – the 38.2% retracement level (red dotted line). Fig. 1 (Weekly Chart).Comprehensive Analysis:Indicator analysis – downwardFibonacci levels – downwardVolumes – downwardCandlestick analysis – downwardTrend analysis – downwardBollinger Bands – downwardMonthly chart – downwardConclusion from comprehensive analysis: downward movement.Overall
Fresh articles are available only to premium users
Read analytics in early access, getting information first