The premium article will be available in00:00:00
29.12.2025 10:23 AM
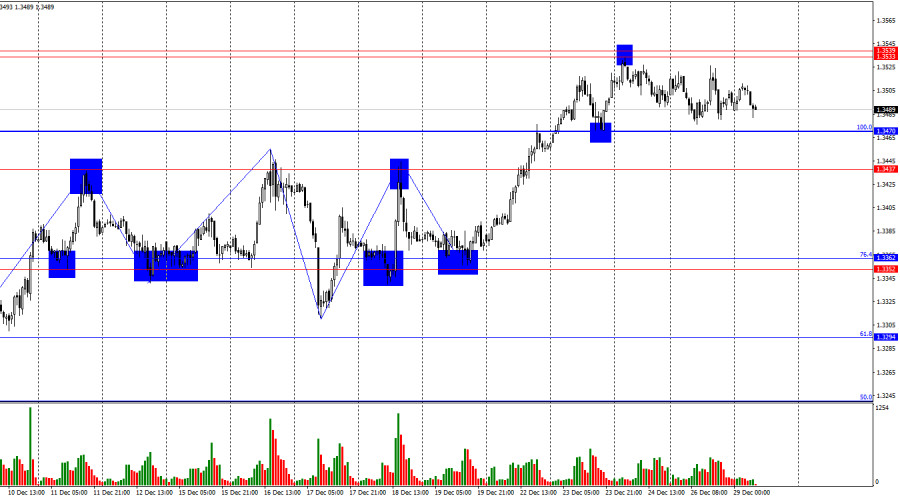
On the hourly chart, the GBP/USD pair on Friday continued its sideways movement between the Fibonacci level of 100.0% at 1.3470 and the resistance level of 1.3533–1.3539. A rebound from either of these levels will generate a trading signal in the opposite direction. A consolidation of prices below 1.3470 will increase the likelihood of a continued decline. A close above the 1.3533–1.3539 level will allow the bulls to launch a new attack. The wave structure has once again transformed
Fresh articles are available only to premium users
Read analytics in early access, getting information first